|
chrX_+_46967360
|
0.305
|
NM_001170460
|
CDK16
|
cyclin-dependent kinase 16
|
|
chr10_-_14090459
|
0.290
|
|
FRMD4A
|
FERM domain containing 4A
|
|
chr6_-_42798286
|
0.288
|
NM_000322
|
PRPH2
|
peripherin 2 (retinal degeneration, slow)
|
|
chr9_-_135435165
|
0.253
|
NM_001080515
|
FAM163B
|
family with sequence similarity 163, member B
|
|
chr17_-_53761119
|
0.229
|
NM_004758
NM_024418
|
BZRAP1
|
benzodiazapine receptor (peripheral) associated protein 1
|
|
chr8_-_81155564
|
0.217
|
NM_001025252
|
TPD52
|
tumor protein D52
|
|
chr10_+_80743769
|
0.211
|
|
ZMIZ1
|
zinc finger, MIZ-type containing 1
|
|
chr3_+_196933481
|
0.210
|
|
MUC20
|
mucin 20, cell surface associated
|
|
chrX_+_38096679
|
0.208
|
NM_000531
|
OTC
|
ornithine carbamoyltransferase
|
|
chr1_+_116181927
|
0.176
|
|
NHLH2
|
nescient helix loop helix 2
|
|
chr6_-_41811916
|
0.175
|
NM_001167827
|
TFEB
|
transcription factor EB
|
|
chr2_-_183095308
|
0.175
|
NM_005019
NM_001003683
|
PDE1A
|
phosphodiesterase 1A, calmodulin-dependent
|
|
chr17_-_36409632
|
0.173
|
NM_031959
|
KRTAP3-2
|
keratin associated protein 3-2
|
|
chr17_+_38256710
|
0.170
|
NM_003734
|
AOC3
|
amine oxidase, copper containing 3 (vascular adhesion protein 1)
|
|
chr6_-_29451042
|
0.163
|
NM_030959
|
OR12D3
|
olfactory receptor, family 12, subfamily D, member 3
|
|
chr1_+_221168388
|
0.163
|
NM_032890
|
DISP1
|
dispatched homolog 1 (Drosophila)
|
|
chr1_-_23393808
|
0.162
|
NM_000864
|
HTR1D
|
5-hydroxytryptamine (serotonin) receptor 1D
|
|
chr19_+_15765760
|
0.159
|
NM_001004466
|
OR10H5
|
olfactory receptor, family 10, subfamily H, member 5
|
|
chr16_-_29817841
|
0.154
|
NM_001114099
NM_001114100
NM_012410
NM_201575
|
SEZ6L2
|
seizure related 6 homolog (mouse)-like 2
|
|
chr5_+_38439399
|
0.154
|
NM_182798
NM_182799
|
EGFLAM
|
EGF-like, fibronectin type III and laminin G domains
|
|
chr17_+_40594046
|
0.152
|
NM_144608
|
HEXIM2
|
hexamthylene bis-acetamide inducible 2
|
|
chr2_+_169367345
|
0.151
|
NM_001039724
NM_001171632
NM_052946
|
NOSTRIN
|
nitric oxide synthase trafficker
|
|
chr14_-_80934523
|
0.150
|
NM_033104
|
STON2
|
stonin 2
|
|
chr16_-_29818334
|
0.150
|
|
SEZ6L2
|
seizure related 6 homolog (mouse)-like 2
|
|
chr19_+_15699833
|
0.149
|
NM_013939
|
OR10H2
|
olfactory receptor, family 10, subfamily H, member 2
|
|
chr4_-_152368492
|
0.142
|
|
SH3D19
|
SH3 domain containing 19
|
|
chrX_+_55951280
|
0.138
|
|
|
|
|
chr7_-_41709191
|
0.136
|
NM_002192
|
INHBA
|
inhibin, beta A
|
|
chr7_+_138695236
|
0.136
|
|
LUC7L2
|
LUC7-like 2 (S. cerevisiae)
|
|
chr19_+_17499064
|
0.136
|
|
FAM129C
|
family with sequence similarity 129, member C
|
|
chr7_+_149104063
|
0.135
|
NM_198455
|
SSPO
|
SCO-spondin homolog (Bos taurus)
|
|
chr10_+_44726635
|
0.134
|
NM_001123376
|
TMEM72
|
transmembrane protein 72
|
|
chr11_-_62445587
|
0.130
|
NM_000738
|
CHRM1
|
cholinergic receptor, muscarinic 1
|
|
chr1_-_203657803
|
0.130
|
NM_001001552
NM_001199050
NM_001199051
NM_001199052
|
LEMD1
|
LEM domain containing 1
|
|
chr2_-_183611470
|
0.126
|
NM_013436
NM_205842
|
NCKAP1
|
NCK-associated protein 1
|
|
chr21_-_33107813
|
0.123
|
NM_001162495
NM_001162496
NM_019596
|
C21orf62
|
chromosome 21 open reading frame 62
|
|
chr2_-_158008763
|
0.122
|
NM_004288
|
CYTIP
|
cytohesin 1 interacting protein
|
|
chr1_+_207926172
|
0.122
|
NM_181755
|
HSD11B1
|
hydroxysteroid (11-beta) dehydrogenase 1
|
|
chr1_-_33585848
|
0.121
|
|
|
|
|
chr21_+_29439768
|
0.120
|
|
C21orf7
|
chromosome 21 open reading frame 7
|
|
chrX_+_85404626
|
0.119
|
NM_001139515
|
DACH2
|
dachshund homolog 2 (Drosophila)
|
|
chr1_-_149004852
|
0.118
|
|
CTSS
|
cathepsin S
|
|
chr17_+_38256886
|
0.117
|
|
|
|
|
chr1_-_205272619
|
0.116
|
NM_001083924
NM_023938
|
C1orf116
|
chromosome 1 open reading frame 116
|
|
chr7_+_138695209
|
0.116
|
|
LUC7L2
|
LUC7-like 2 (S. cerevisiae)
|
|
chr7_+_75977680
|
0.113
|
NM_030570
NM_182684
|
UPK3B
|
uroplakin 3B
|
|
chr7_+_138695537
|
0.113
|
|
LUC7L2
|
LUC7-like 2 (S. cerevisiae)
|
|
chr11_-_62445308
|
0.107
|
|
CHRM1
|
cholinergic receptor, muscarinic 1
|
|
chr2_-_151854619
|
0.105
|
NM_004688
|
NMI
|
N-myc (and STAT) interactor
|
|
chr1_-_176205672
|
0.102
|
NM_033127
|
SEC16B
|
SEC16 homolog B (S. cerevisiae)
|
|
chr1_-_144426918
|
0.102
|
NM_007053
|
CD160
|
CD160 molecule
|
|
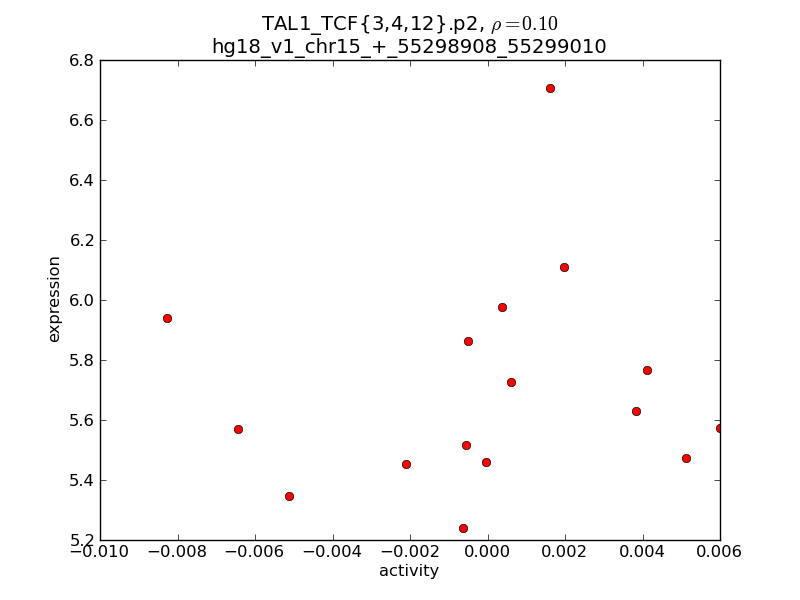
chr15_+_55298908
|
0.100
|
NM_207040
|
TCF12
|
transcription factor 12
|
|
chrX_-_110400406
|
0.099
|
NM_014289
|
CAPN6
|
calpain 6
|
|
chr9_+_114376709
|
0.095
|
|
KIAA1958
|
KIAA1958
|
|
chr6_-_29431950
|
0.095
|
NM_030876
|
OR5V1
|
olfactory receptor, family 5, subfamily V, member 1
|
|
chr7_+_138695241
|
0.090
|
|
LUC7L2
|
LUC7-like 2 (S. cerevisiae)
|
|
chr6_+_36318922
|
0.090
|
NM_173676
NM_001145716
|
PNPLA1
|
patatin-like phospholipase domain containing 1
|
|
chrX_-_19598912
|
0.089
|
NM_001184960
|
SH3KBP1
|
SH3-domain kinase binding protein 1
|
|
chr7_+_94953148
|
0.087
|
NM_016116
NM_145872
|
ASB4
|
ankyrin repeat and SOCS box containing 4
|
|
chrX_+_102918409
|
0.087
|
NM_000533
NM_199478
|
PLP1
|
proteolipid protein 1
|
|
chr12_-_46405477
|
0.086
|
NM_001172439
NM_001172440
NM_006025
|
ENDOU
|
endonuclease, polyU-specific
|
|
chr4_-_20594645
|
0.086
|
|
KCNIP4
|
Kv channel interacting protein 4
|
|
chr4_+_73123712
|
0.085
|
NM_001144756
NM_053036
|
NPFFR2
|
neuropeptide FF receptor 2
|
|
chr7_+_129807467
|
0.085
|
NM_001868
|
CPA1
|
carboxypeptidase A1 (pancreatic)
|
|
chr1_+_50342168
|
0.084
|
NM_001144776
|
ELAVL4
|
ELAV (embryonic lethal, abnormal vision, Drosophila)-like 4 (Hu antigen D)
|
|
chr1_+_54786394
|
0.082
|
NM_015547
NM_147161
|
ACOT11
|
acyl-CoA thioesterase 11
|
|
chrX_-_33267646
|
0.082
|
NM_000109
|
DMD
|
dystrophin
|
|
chr3_-_44527122
|
0.078
|
|
ZNF852
|
zinc finger protein 852
|
|
chr2_+_33213111
|
0.077
|
NM_000627
NM_001166264
NM_001166265
NM_001166266
|
LTBP1
|
latent transforming growth factor beta binding protein 1
|
|
chrX_+_46825179
|
0.075
|
|
RGN
|
regucalcin (senescence marker protein-30)
|
|
chr15_+_72687765
|
0.075
|
NM_003992
|
CLK3
|
CDC-like kinase 3
|
|
chr2_-_133256097
|
0.075
|
|
NCKAP5
|
NCK-associated protein 5
|
|
chr22_+_20880112
|
0.075
|
|
|
|
|
chr17_-_44641741
|
0.075
|
NM_031498
NM_001198755
NM_001198756
|
GNGT2
|
guanine nucleotide binding protein (G protein), gamma transducing activity polypeptide 2
|
|
chr11_-_5212168
|
0.073
|
NM_000519
|
HBD
|
hemoglobin, delta
|
|
chrX_+_102918453
|
0.073
|
|
PLP1
|
proteolipid protein 1
|
|
chr8_+_21967008
|
0.073
|
NM_001114137
|
EPB49
|
erythrocyte membrane protein band 4.9 (dematin)
|
|
chr3_-_44527083
|
0.071
|
|
ZNF852
|
zinc finger protein 852
|
|
chrX_-_46503415
|
0.071
|
NM_032591
|
SLC9A7
|
solute carrier family 9 (sodium/hydrogen exchanger), member 7
|
|
chr1_+_92405196
|
0.070
|
NM_015237
|
KIAA1107
|
KIAA1107
|
|
chrX_-_15593074
|
0.070
|
NM_020665
|
TMEM27
|
transmembrane protein 27
|
|
chrX_-_46503540
|
0.069
|
|
SLC9A7
|
solute carrier family 9 (sodium/hydrogen exchanger), member 7
|
|
chr1_-_199613427
|
0.069
|
NM_000364
NM_001001430
NM_001001431
NM_001001432
|
TNNT2
|
troponin T type 2 (cardiac)
|
|
chr7_+_138695144
|
0.068
|
NM_016019
|
LUC7L2
|
LUC7-like 2 (S. cerevisiae)
|
|
chr6_-_169392771
|
0.066
|
|
|
|
|
chr7_+_127020924
|
0.066
|
NM_020369
|
FSCN3
|
fascin homolog 3, actin-bundling protein, testicular (Strongylocentrotus purpuratus)
|
|
chr1_+_32489426
|
0.064
|
NM_005356
|
LCK
|
lymphocyte-specific protein tyrosine kinase
|
|
chr1_-_149004879
|
0.063
|
|
CTSS
|
cathepsin S
|
|
chr22_+_38652555
|
0.060
|
|
GRAP2
|
GRB2-related adaptor protein 2
|
|
chr12_-_55404530
|
0.060
|
|
NACA
|
nascent polypeptide-associated complex alpha subunit
|
|
chr17_-_10362583
|
0.060
|
NM_005963
|
MYH1
|
myosin, heavy chain 1, skeletal muscle, adult
|
|
chrX_+_128741562
|
0.060
|
NM_018990
|
SASH3
|
SAM and SH3 domain containing 3
|
|
chrX_+_138440560
|
0.059
|
NM_000133
|
F9
|
coagulation factor IX
|
|
chr5_+_53787187
|
0.059
|
NM_006308
|
HSPB3
|
heat shock 27kDa protein 3
|
|
chr11_-_4827013
|
0.058
|
NM_001004758
|
OR51S1
|
olfactory receptor, family 51, subfamily S, member 1
|
|
chr3_-_188936941
|
0.058
|
NM_001130845
|
BCL6
|
B-cell CLL/lymphoma 6
|
|
chr22_+_19601940
|
0.057
|
|
CRKL
|
v-crk sarcoma virus CT10 oncogene homolog (avian)-like
|
|
chrX_+_48127911
|
0.057
|
NM_001034832
NM_001040612
NM_005636
NM_175729
|
SSX4B
SSX4
|
synovial sarcoma, X breakpoint 4B
synovial sarcoma, X breakpoint 4
|
|
chr12_-_121753795
|
0.057
|
NM_177551
|
GPR109A
|
G protein-coupled receptor 109A
|
|
chr11_-_74478405
|
0.056
|
NM_001005285
|
OR2AT4
|
olfactory receptor, family 2, subfamily AT, member 4
|
|
chrX_+_102918089
|
0.055
|
NM_001128834
|
PLP1
|
proteolipid protein 1
|
|
chr3_-_196792274
|
0.055
|
NM_001647
|
APOD
|
apolipoprotein D
|
|
chr9_-_14712669
|
0.054
|
NM_005454
|
CER1
|
cerberus 1, cysteine knot superfamily, homolog (Xenopus laevis)
|
|
chrX_-_47941142
|
0.054
|
NM_021015
NM_175723
|
SSX5
|
synovial sarcoma, X breakpoint 5
|
|
chr6_-_27988152
|
0.054
|
NM_033057
|
OR2B2
|
olfactory receptor, family 2, subfamily B, member 2
|
|
chr2_+_151922350
|
0.053
|
NM_007115
|
TNFAIP6
|
tumor necrosis factor, alpha-induced protein 6
|
|
chr14_+_19414230
|
0.053
|
NM_001005501
|
OR4K2
|
olfactory receptor, family 4, subfamily K, member 2
|
|
chr4_-_77176163
|
0.053
|
NM_005409
|
CXCL11
|
chemokine (C-X-C motif) ligand 11
|
|
chr3_+_113200696
|
0.053
|
NM_001008273
|
TAGLN3
|
transgelin 3
|
|
chr8_-_11966664
|
0.053
|
NM_001195257
NM_001037804
|
LOC100133267
DEFB130
|
defensin, beta 130-like
defensin, beta 130
|
|
chr11_-_57752923
|
0.052
|
NM_001004471
|
OR10Q1
|
olfactory receptor, family 10, subfamily Q, member 1
|
|
chr19_-_44060729
|
0.052
|
NM_001195833
NM_198445
|
RINL
|
Ras and Rab interactor-like
|
|
chr11_-_66431910
|
0.052
|
NM_022172
|
PC
|
pyruvate carboxylase
|
|
chrX_-_110400321
|
0.052
|
|
CAPN6
|
calpain 6
|
|
chr17_-_59342319
|
0.052
|
NM_001318
NM_022579
NM_022580
NM_022581
|
CSHL1
|
chorionic somatomammotropin hormone-like 1
|
|
chr11_+_72658586
|
0.051
|
NM_176798
|
P2RY6
|
pyrimidinergic receptor P2Y, G-protein coupled, 6
|
|
chr17_+_45617676
|
0.051
|
|
|
|
|
chr10_+_85923473
|
0.051
|
NM_207373
|
C10orf99
|
chromosome 10 open reading frame 99
|
|
chr1_-_149004916
|
0.050
|
NM_004079
|
CTSS
|
cathepsin S
|
|
chr1_+_156842852
|
0.050
|
NM_001004478
|
OR10Z1
|
olfactory receptor, family 10, subfamily Z, member 1
|
|
chr16_-_79811475
|
0.050
|
NM_001076780
NM_052892
|
PKD1L2
|
polycystic kidney disease 1-like 2
|
|
chr5_-_88235624
|
0.050
|
NM_001131005
NM_001193347
|
MEF2C
|
myocyte enhancer factor 2C
|
|
chr5_-_158690047
|
0.050
|
NM_002187
|
IL12B
|
interleukin 12B (natural killer cell stimulatory factor 2, cytotoxic lymphocyte maturation factor 2, p40)
|
|
chr22_+_43451600
|
0.049
|
|
PRR5
|
proline rich 5 (renal)
|
|
chr5_+_173405298
|
0.049
|
NM_015980
|
HMP19
|
HMP19 protein
|
|
chr9_+_95886625
|
0.048
|
|
PTPDC1
|
protein tyrosine phosphatase domain containing 1
|
|
chr12_-_129568362
|
0.047
|
NM_015347
|
RIMBP2
|
RIMS binding protein 2
|
|
chr8_-_86441115
|
0.047
|
NM_001164830
|
CA1
|
carbonic anhydrase I
|
|
chr3_+_9933763
|
0.046
|
NM_032732
NM_153460
NM_153461
|
IL17RC
|
interleukin 17 receptor C
|
|
chr8_-_142586487
|
0.046
|
NM_207414
|
FLJ43860
|
FLJ43860 protein
|
|
chr19_-_14853166
|
0.045
|
NM_030901
|
OR7A17
|
olfactory receptor, family 7, subfamily A, member 17
|
|
chr17_-_74244539
|
0.045
|
|
|
|
|
chr19_+_56452775
|
0.044
|
NM_173635
|
C19orf75
|
chromosome 19 open reading frame 75
|
|
chr2_-_96320185
|
0.044
|
|
SNRNP200
|
small nuclear ribonucleoprotein 200kDa (U5)
|
|
chrX_+_123307812
|
0.043
|
NM_001114937
NM_002351
|
SH2D1A
|
SH2 domain containing 1A
|
|
chr1_+_33003814
|
0.043
|
NM_001198972
NM_001198973
|
KIAA1522
|
KIAA1522
|
|
chr21_+_38550739
|
0.042
|
NM_170736
|
KCNJ15
|
potassium inwardly-rectifying channel, subfamily J, member 15
|
|
chr2_+_108360798
|
0.042
|
NM_006588
|
SULT1C4
|
sulfotransferase family, cytosolic, 1C, member 4
|
|
chr2_-_55131124
|
0.042
|
|
RTN4
|
reticulon 4
|
|
chr9_+_95886558
|
0.042
|
NM_152422
|
PTPDC1
|
protein tyrosine phosphatase domain containing 1
|
|
chr2_-_55130925
|
0.042
|
|
RTN4
|
reticulon 4
|
|
chr2_-_55131157
|
0.041
|
|
RTN4
|
reticulon 4
|
|
chr1_+_158063278
|
0.040
|
|
SLAMF8
|
SLAM family member 8
|
|
chr12_+_61240542
|
0.040
|
|
MON2
|
MON2 homolog (S. cerevisiae)
|
|
chr6_-_41811323
|
0.040
|
|
TFEB
|
transcription factor EB
|
|
chr1_+_22835684
|
0.040
|
NM_015991
|
C1QA
|
complement component 1, q subcomponent, A chain
|
|
chr17_-_1037312
|
0.039
|
NM_001159746
|
ABR
|
active BCR-related gene
|
|
chr2_-_55131176
|
0.039
|
|
RTN4
|
reticulon 4
|
|
chr16_+_4546491
|
0.038
|
NM_001145011
|
LOC342346
|
hypothetical protein LOC342346
|
|
chrX_-_2896285
|
0.038
|
|
ARSE
|
arylsulfatase E (chondrodysplasia punctata 1)
|
|
chrX_-_55074125
|
0.038
|
NM_000032
NM_001037967
NM_001037968
|
ALAS2
|
aminolevulinate, delta-, synthase 2
|
|
chr15_+_38886546
|
0.038
|
NM_001077268
|
ZFYVE19
|
zinc finger, FYVE domain containing 19
|
|
chr22_-_16127520
|
0.037
|
|
CECR3
|
cat eye syndrome chromosome region, candidate 3
|
|
chrX_-_55037235
|
0.037
|
NM_002625
|
PFKFB1
|
6-phosphofructo-2-kinase/fructose-2,6-biphosphatase 1
|
|
chr1_-_151280201
|
0.036
|
NM_006945
|
SPRR2D
|
small proline-rich protein 2D
|
|
chr1_+_33003847
|
0.036
|
|
KIAA1522
|
KIAA1522
|
|
chr1_-_202432165
|
0.035
|
NM_002256
|
KISS1
|
KiSS-1 metastasis-suppressor
|
|
chr14_-_93919305
|
0.035
|
|
SERPINA1
|
serpin peptidase inhibitor, clade A (alpha-1 antiproteinase, antitrypsin), member 1
|
|
chr19_-_40996040
|
0.035
|
NM_021232
|
PRODH2
|
proline dehydrogenase (oxidase) 2
|
|
chr16_+_21623784
|
0.035
|
NM_170664
|
OTOA
|
otoancorin
|
|
chrX_+_128741578
|
0.035
|
|
SASH3
|
SAM and SH3 domain containing 3
|
|
chr1_-_199613406
|
0.035
|
|
TNNT2
|
troponin T type 2 (cardiac)
|
|
chr2_-_55131096
|
0.035
|
|
RTN4
|
reticulon 4
|
|
chr10_-_121286034
|
0.034
|
NM_002925
|
RGS10
|
regulator of G-protein signaling 10
|
|
chr1_-_108588186
|
0.034
|
NM_001143989
|
NBPF4
NBPF6
|
neuroblastoma breakpoint family, member 4
neuroblastoma breakpoint family, member 6
|
|
chr8_-_72436519
|
0.034
|
|
EYA1
|
eyes absent homolog 1 (Drosophila)
|
|
chr17_+_6599879
|
0.034
|
NM_017523
NM_199139
|
XAF1
|
XIAP associated factor 1
|
|
chr6_+_29249289
|
0.034
|
NM_030905
|
OR2J2
|
olfactory receptor, family 2, subfamily J, member 2
|
|
chr7_-_44071640
|
0.034
|
NM_000290
|
PGAM2
|
phosphoglycerate mutase 2 (muscle)
|
|
chr10_+_71482362
|
0.033
|
NM_018649
|
H2AFY2
|
H2A histone family, member Y2
|
|
chr7_+_104539548
|
0.033
|
|
MLL5
|
myeloid/lymphoid or mixed-lineage leukemia 5 (trithorax homolog, Drosophila)
|
|
chr11_-_123130435
|
0.033
|
NM_001005188
|
OR6X1
|
olfactory receptor, family 6, subfamily X, member 1
|
|
chr11_+_5367182
|
0.033
|
NM_001004756
|
OR51M1
|
olfactory receptor, family 51, subfamily M, member 1
|
|
chr1_-_16006779
|
0.032
|
NM_001089591
|
UQCRHL
|
ubiquinol-cytochrome c reductase hinge protein-like
|
|
chr6_-_32227695
|
0.032
|
NM_030651
|
PRRT1
|
proline-rich transmembrane protein 1
|
|
chr11_+_125000245
|
0.032
|
NM_001114121
NM_001114122
|
CHEK1
|
CHK1 checkpoint homolog (S. pombe)
|
|
chr8_-_12220195
|
0.032
|
NM_001195257
NM_001037804
|
LOC100133267
DEFB130
|
defensin, beta 130-like
defensin, beta 130
|
|
chr19_-_59438411
|
0.032
|
NM_024318
|
LILRB3
LILRA6
|
leukocyte immunoglobulin-like receptor, subfamily B (with TM and ITIM domains), member 3
leukocyte immunoglobulin-like receptor, subfamily A (with TM domain), member 6
|
|
chrX_-_111809929
|
0.032
|
NM_178175
|
LHFPL1
|
lipoma HMGIC fusion partner-like 1
|
|
chr19_+_51190535
|
0.032
|
|
CCDC61
|
coiled-coil domain containing 61
|
|
chr15_-_58706934
|
0.032
|
NM_002943
NM_134260
|
RORA
|
RAR-related orphan receptor A
|
|
chr17_-_70053839
|
0.032
|
NM_006678
|
CD300C
|
CD300c molecule
|
|
chr5_+_173405343
|
0.032
|
|
HMP19
|
HMP19 protein
|
|
chr4_-_24523605
|
0.032
|
NM_001130726
|
CCDC149
|
coiled-coil domain containing 149
|
|
chr20_-_36191623
|
0.031
|
|
TGM2
|
transglutaminase 2 (C polypeptide, protein-glutamine-gamma-glutamyltransferase)
|
|
chr2_-_97775300
|
0.031
|
|
TMEM131
|
transmembrane protein 131
|
|
chr16_+_11966464
|
0.031
|
NM_001192
|
TNFRSF17
|
tumor necrosis factor receptor superfamily, member 17
|
|
chr5_+_67558217
|
0.031
|
NM_181523
|
PIK3R1
|
phosphoinositide-3-kinase, regulatory subunit 1 (alpha)
|
|
chrX_-_32340291
|
0.030
|
NM_004011
NM_004012
|
DMD
|
dystrophin
|
|
chr14_-_20179689
|
0.030
|
NM_001001968
|
OR6S1
|
olfactory receptor, family 6, subfamily S, member 1
|
|
chr1_+_50344550
|
0.030
|
NM_001144775
|
ELAVL4
|
ELAV (embryonic lethal, abnormal vision, Drosophila)-like 4 (Hu antigen D)
|
|
chr7_+_143457083
|
0.030
|
NM_001001659
|
OR2A14
|
olfactory receptor, family 2, subfamily A, member 14
|
|
chr1_+_17817397
|
0.029
|
|
ARHGEF10L
|
Rho guanine nucleotide exchange factor (GEF) 10-like
|
|
chr6_+_126143971
|
0.029
|
|
NCOA7
|
nuclear receptor coactivator 7
|
|
chr16_-_20246309
|
0.029
|
NM_001007240
NM_001007241
NM_001007242
NM_001502
|
GP2
|
glycoprotein 2 (zymogen granule membrane)
|
|
chrX_-_74292800
|
0.029
|
NM_004299
|
ABCB7
|
ATP-binding cassette, sub-family B (MDR/TAP), member 7
|
|
chr1_+_205328834
|
0.029
|
NM_001017365
NM_001017366
|
C4BPB
|
complement component 4 binding protein, beta
|
|
chr17_-_58237742
|
0.029
|
NM_001100875
|
MARCH10
|
membrane-associated ring finger (C3HC4) 10
|
|
chr9_-_135379888
|
0.029
|
NM_001080483
|
TMEM8C
|
transmembrane protein 8C
|
|
chr2_-_55130963
|
0.029
|
|
RTN4
|
reticulon 4
|